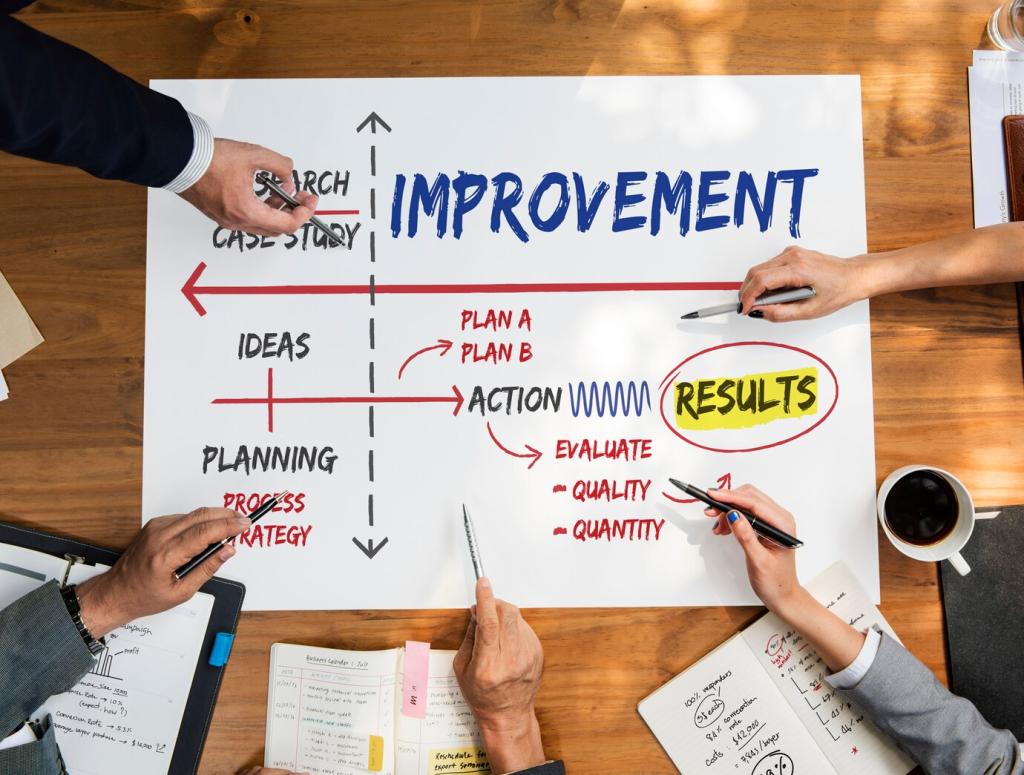
Measure Before You Optimize
Pick concrete targets like p95 cold start under 1.5 seconds, time-to-interactive under 2.5 seconds, and jank rate below 0.3%. Write them down as performance budgets and track weekly. What KPIs are you chasing? Comment with your numbers and lessons learned.
Measure Before You Optimize
Lean on Android Studio Profiler, Xcode Instruments, Firebase Performance, and system traces to find hotspots. A team I coached discovered main-thread JSON parsing during launch via Instruments’ Time Profiler—five lines moved off the main thread cut startup by 400 milliseconds. Share your favorite tool combo.


